PPP GDP per Capita by Country in Africa (2027)
GDP per capita adjusted for differences in price levels across countries. An international dollar has roughly the same purchasing power as $1 in the U.S.
Filter by:
Regions
Categories
Showing: 52 (0 territories)
High to low
2027
| 1 | Seychelles | 39,545 | ||
| 2 | Mauritius | 37,805 | ||
| 3 | Gabon | 27,257 | ||
| 4 | Egypt | 25,019 | ||
| 5 | Botswana | 23,030 | ||
| 6 | Algeria | 20,746 | ||
| 7 | Libya | 19,149 | ||
| 8 | Equatorial Guinea | 18,756 | ||
| 9 | South Africa | 17,392 | ||
| 10 | Tunisia | 16,780 | ||
| 11 | Cabo Verde | 14,507 | ||
| 12 | Eswatini | 14,146 | ||
| 13 | Morocco | 13,239 | ||
| 14 | Namibia | 13,006 | ||
| 15 | Angola | 11,025 | ||
| 16 | Djibouti | 10,772 | ||
| 17 | Nigeria | 10,593 | ||
| 18 | Ghana | 9,857 | ||
| 19 | Mauritania | 9,723 | ||
| 20 | Côte d’Ivoire | 9,250 | ||
| 21 | Zimbabwe | 8,885 | ||
| 22 | Guinea | 8,686 | ||
| 23 | Kenya | 8,531 | ||
| 24 | Republic of the Congo | 7,087 | ||
| 25 | São Tomé and Príncipe | 6,702 | ||
| 26 | Cameroon | 6,288 | ||
| 27 | Benin | 5,550 | ||
| 28 | Ethiopia | 5,466 | ||
| 29 | Rwanda | 5,036 | ||
| 30 | Zambia | 4,899 | ||
| 31 | Tanzania | 4,726 | ||
| 32 | Togo | 4,544 | ||
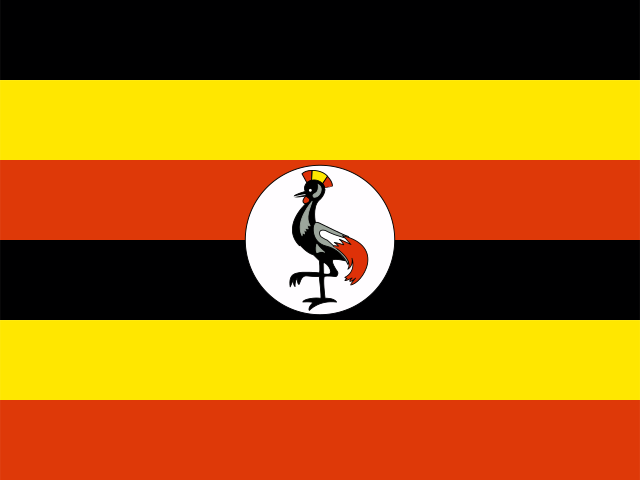
| 33 | Uganda | 4,508 | ||
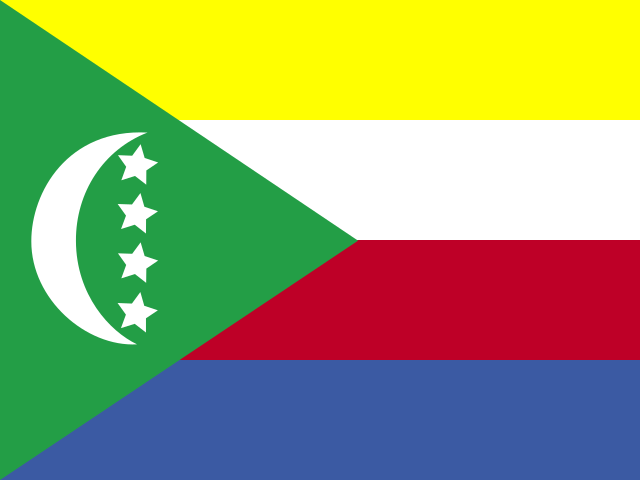
| 34 | Comoros | 4,366 | ||
| 35 | Sierra Leone | 4,151 | ||
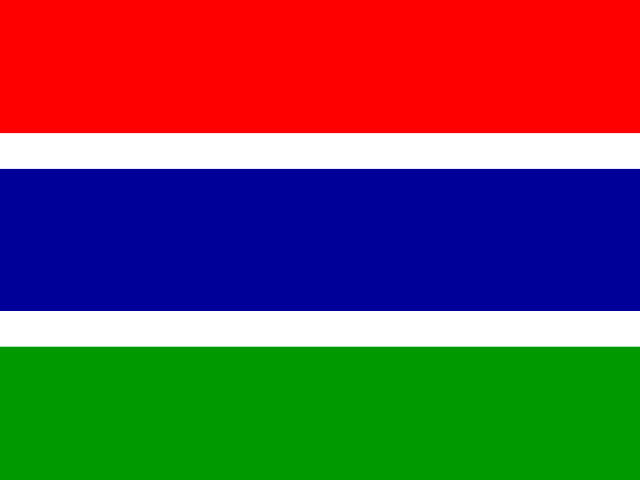
| 36 | Gambia | 4,111 | ||
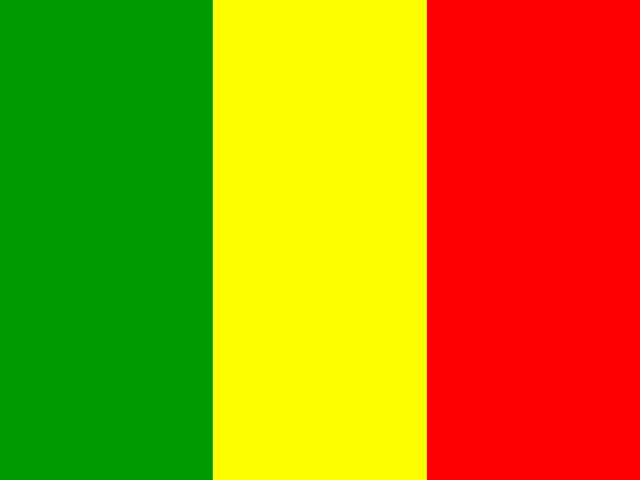
| 37 | Mali | 3,898 | ||
| 38 | Guinea-Bissau | 3,725 | ||
| 39 | Chad | 3,633 | ||
| 40 | Burkina Faso | 3,425 | ||
| 41 | Lesotho | 3,419 | ||
| 42 | Sudan | 2,978 | ||
| 43 | Niger | 2,343 | ||
| 44 | DR Congo | 2,258 | ||
| 45 | Liberia | 2,239 | ||
| 46 | Central African Republic | 2,238 | ||
| 47 | Madagascar | 2,228 | ||
| 48 | Somalia | 2,037 | ||
| 49 | Malawi | 1,865 | ||
| 50 | Mozambique | 1,762 | ||
| 51 | South Sudan | 1,661 | ||
| 52 | Burundi | 1,086 |