PPP GDP by Country in North America (2027)
GDP adjusted for differences in price levels across countries. An international dollar has roughly the same purchasing power as $1 in the U.S.
Filter by:
Regions
Categories
Showing: 24 (2 territories)
World Share: 18%
High to low
2027
| 1 | United States | 34.44T | ||
| 2 | Mexico | 3.77T | ||
| 3 | Canada | 3.06T | ||
| 4 | Dominican Republic | 385.1B | ||
| 5 | Guatemala | 326.7B | ||
| 6 | Panama | 234.1B | ||
| 7 | Costa Rica | 197.8B | ||
| 8 | Puerto Rico | 178.8B | ||
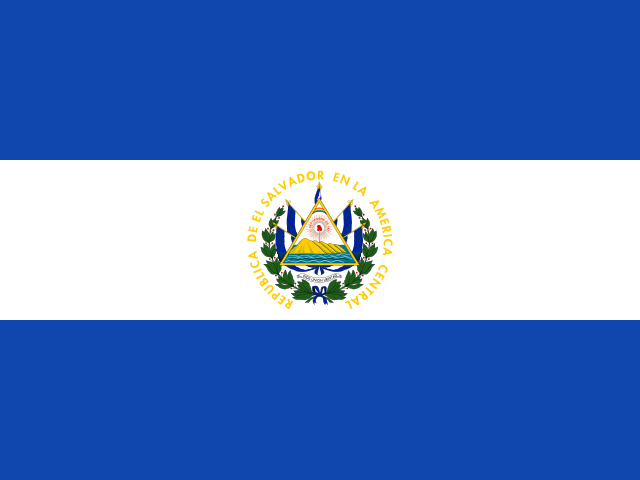
| 9 | El Salvador | 104B | ||
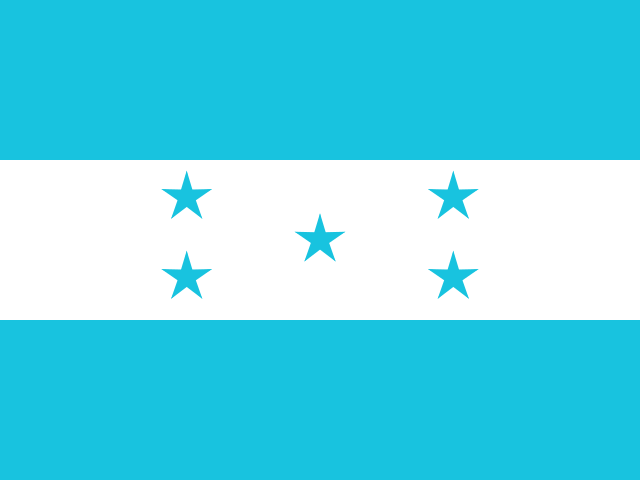
| 10 | Honduras | 98.64B | ||
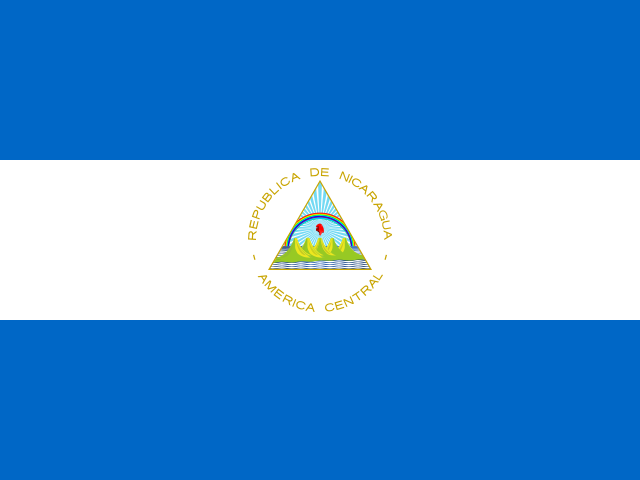
| 11 | Nicaragua | 74.75B | ||
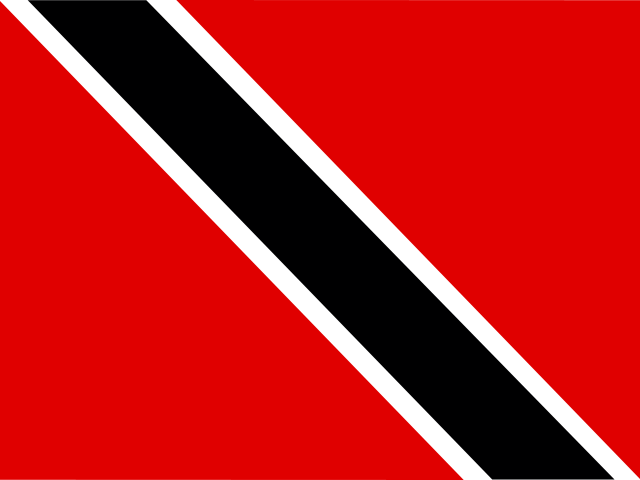
| 12 | Trinidad and Tobago | 55.77B | ||
| 13 | Jamaica | 41.17B | ||
| 14 | Haiti | 39.26B | ||
| 15 | Bahamas | 20.7B | ||
| 16 | Barbados | 8.12B | ||
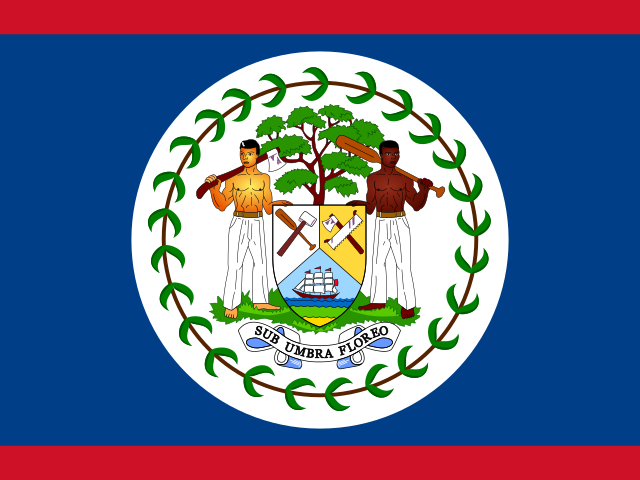
| 17 | Belize | 7B | ||
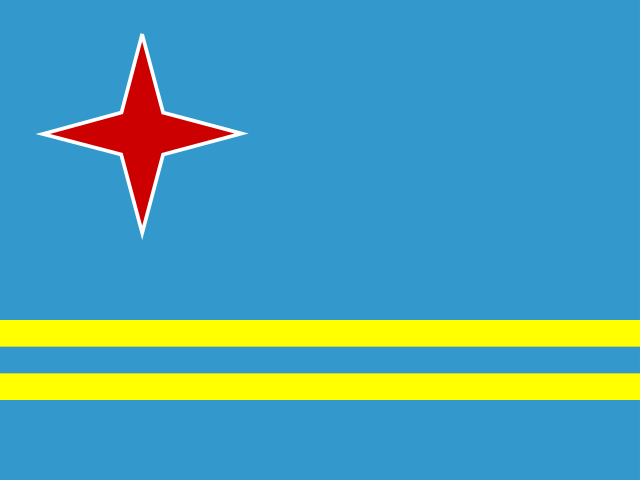
| 18 | Aruba | 6.84B | ||
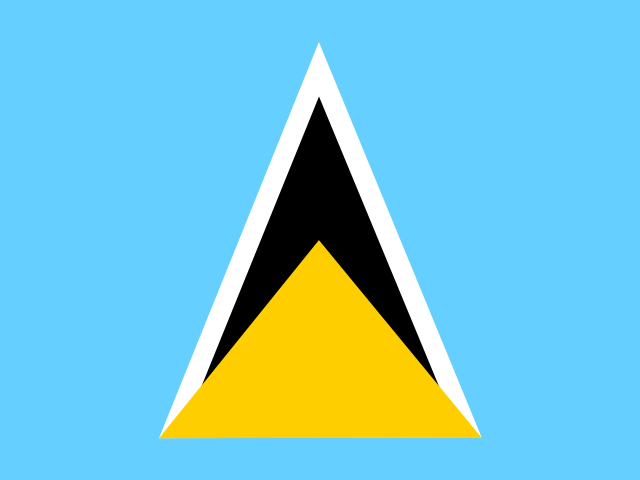
| 19 | Saint Lucia | 5.67B | ||
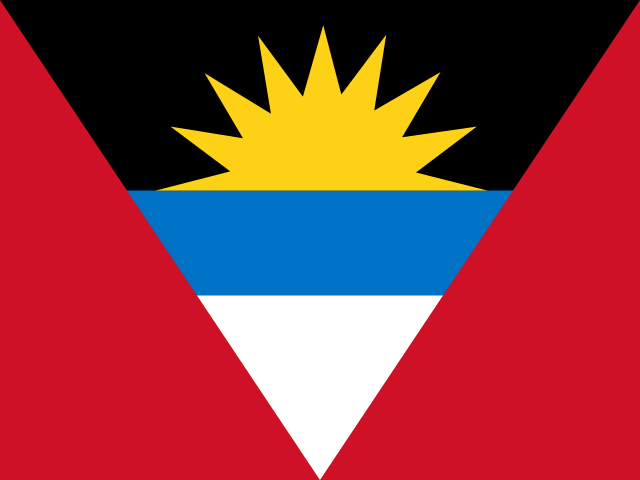
| 20 | Antigua and Barbuda | 3.71B | ||
| 21 | Grenada | 2.89B | ||
| 22 | Saint Vincent and the Grenadines | 2.56B | ||
| 23 | Saint Kitts and Nevis | 1.92B | ||
| 24 | Dominica | 1.66B |